Section 3.1
This section measured the response characteristics of the band-pass filter, calibrating it such that the gain integral would be usable in the upcoming Johnson Noise measurements.
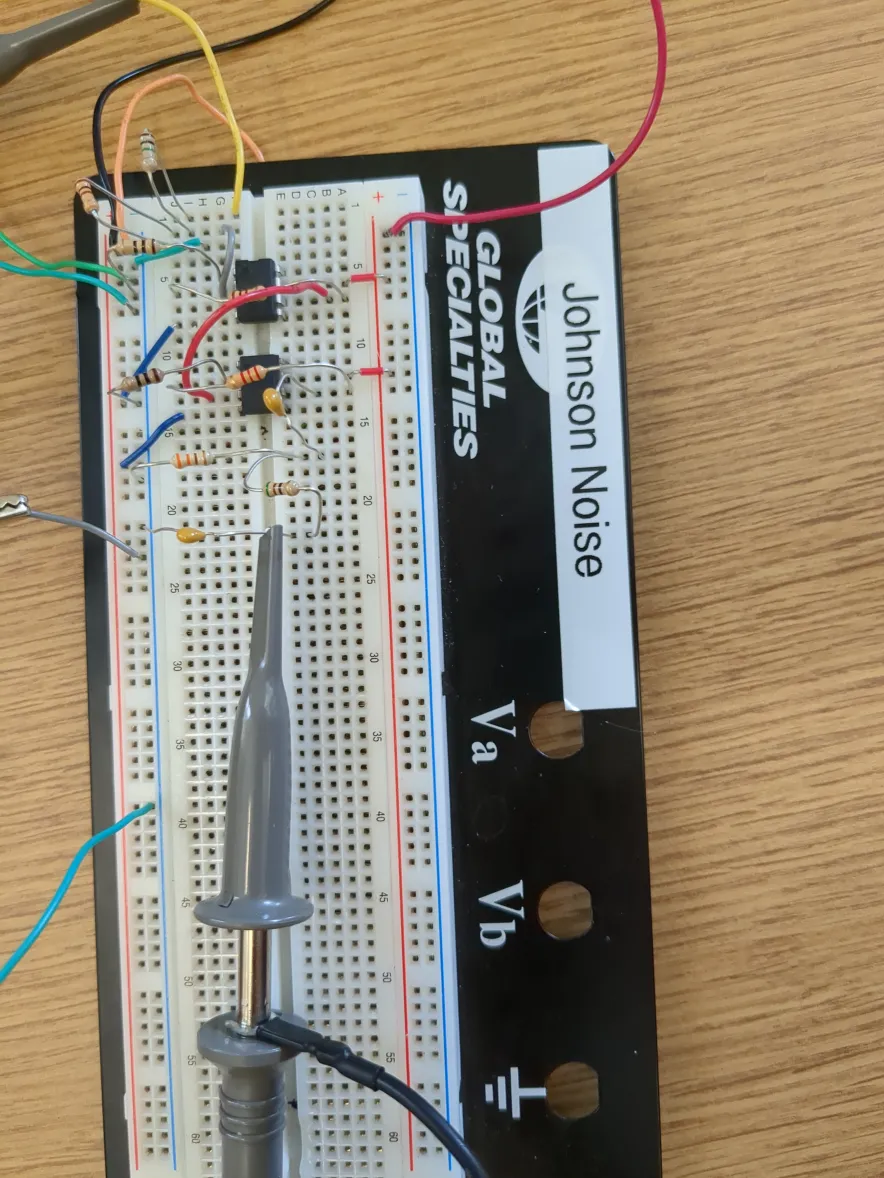
Procedure
- We began by selecting several frequencies to test, in the range from 1-100 kHz.
- For each one of these frequency values, we measured the input and output voltage using the oscilloscope.
- After obtaining these voltage measurements, we were able to calculate the system gain and therefore obtained the correct calibration metrics for the Johnson noise
Data:
data
Analysis:
Theoretical Gain Calculations:
High Pass Filter:
A high pass filter is designed to let higher frequencies pass through without being attenuated, while attenuating lower frequencies. The formula for the cutoff frequency on a high pass filter is as follows:
We wanted a high-pass cutoff of around 5 kHz, so setting to 5 kHz we can solve for required values of while using a capacitor
Low Pass Filter
A low pass filter is the opposite of a high pass filter, where it allows the lower frequencies to pass through while attenuating higher frequencies out. The cutoff frequency is given by the same equation:
We wanted a low-pass cutoff of around 20 kHz, and we used the same capacitor. Solving for required resistance:
Actual Resistances and capacitance’s
| Actual Values | R | C |
|---|---|---|
| Low Pass Filter | ||
| High Pass Filter |
Theoretical Cutoff Values using measured components: Low pass:
High pass:
Theoretical Gain Curve:
Experimental Data:
| Pk-Pk Voltage | 1kHz | 3kHz | 5kHz | 25kHz | 50kHz | 100kHz |
|---|---|---|---|---|---|---|
| Channel 1 (output) | ||||||
| Channel 2 (inpiut) |
Calculated Gain:
| 1kHz | 3kHz | 5kHz | 25kHz | 50kHz | 100kHz | |
|---|---|---|---|---|---|---|
| Calculated gain | 0.046 | 0.092 | 0.110 | 0.051 | 0.014 | 0.004 |
Conclusion:
In this section we successfully fit a pair of mathematical models to model the frequency response of our band-pass filter/amplifier circuit. These models qualitatively fit the data well, however, the chi squared parameter tells us that the data model is highly over-constrained. This logically makes sense, we have limited data points and several parameters to fit to. Despite this, we are able to use these models to evaluate the integral that we need for section 3.2.
Section 3.2
After we calibrated the experimental setup’s band pass filter and obtained the total op-amp gain, we were ready to take measurements of the generated Johnson noise using a variety of resistors.
Procedure
- We began this portion of the lab by removing the function generator and voltage divider circuit from the experimental setup.
- After these components were removed, a selection of resistors from between 10 and 10 were selected to serve as the generators of the Johnson noise.
- At this point the room’s air temperature was recorded for usage during the analysis.
- Finally, we recorded the oscilloscope output of the Johnson noise for 6 different resistance values.
Data
Room temperature: 26 degrees Celsius
Resistance for each trial:
| Trial | R |
|---|---|
| 1 | |
| 2 | |
| 3 | |
| 4 | |
| 5 | |
| 6 |
Analysis:
We evaluate this integral to find the expectation value of
For each value of R we will evaluate this. Then we will fit a curve fit to this function to solve for Boltzmann’s constant.
Conclusion:
This section yielded mixed results, our data acquisition had large discrepancies from the model. This is evidenced by the large chi-squared model in figure 6 of 255.9. This signals a very poor correlation to the model. This initial analysis additionally yielded a calculated Boltzmann constant that was incoherent with the literature values of the Boltzmann constant by a factor of approximately 10,000. Possible reasons for these large discrepancies may include temperature fluctuations or errant spikes in background radiation interfering with readings on the oscilloscope. The data’s fit was improved by removing the 4th data point, which yielded a Chi-squared value of 16.8, an approximate tenfold decrease over the previous fit. This signaled a much better fit, and the value of the calculated Boltzmann constant was also correspondingly closer to the literature values, but still 3 orders of magnitude away from the correct value. This experiment could be improved by adding more robust temperature monitoring capabilities, as well as EM radiation shielding around the experimental setup in the form of a Faraday cage.
Section 3.3: Johnson Noise- Teachspin Approach
Procedure
- The experiment was set up by following the parameters outlined in the “Teachspin Approach” document. The band pass filter components, gain, multiplier and output were all set to specific values.
- After we had set up the experiment with the appropriate settings, we collected data for different resistance values using a high-precision digital multimeter.
- These data values along with the corresponding resistances were recorded into a table for further analysis.
Data
Pre-amp gain: 600x Amp Gain: 400x
| Resistance | Voltage |
|---|---|
| 1 Ohm | 38.90mV |
| 10 Ohms | 39.03mV |
| 100 Ohms | 40.05mV |
| 1k Ohms | 49.94mV |
| 10k Ohms | 149.01mV |
| 100k Ohms | 861.1 mV |
Analysis
Measured Voltage follows this formula:
Where is the Johnson noise and represents the intrinsic noise of the system.
Taking the RMS of this system:
Conclusions:
This section yielded much better values then the previous section. The data fit the linear model much more accurately, leading to the literature-accurate value within the calculated error for the Boltzmann constant. The last data point at 100 had a large error due to the multimeter auto-ranging to the volt range as opposed to the milli-volt range before, but the model fits all of the other points very well, with a overall chi-squared value of 0.79, signifying a well-constrained, accurate fit.